
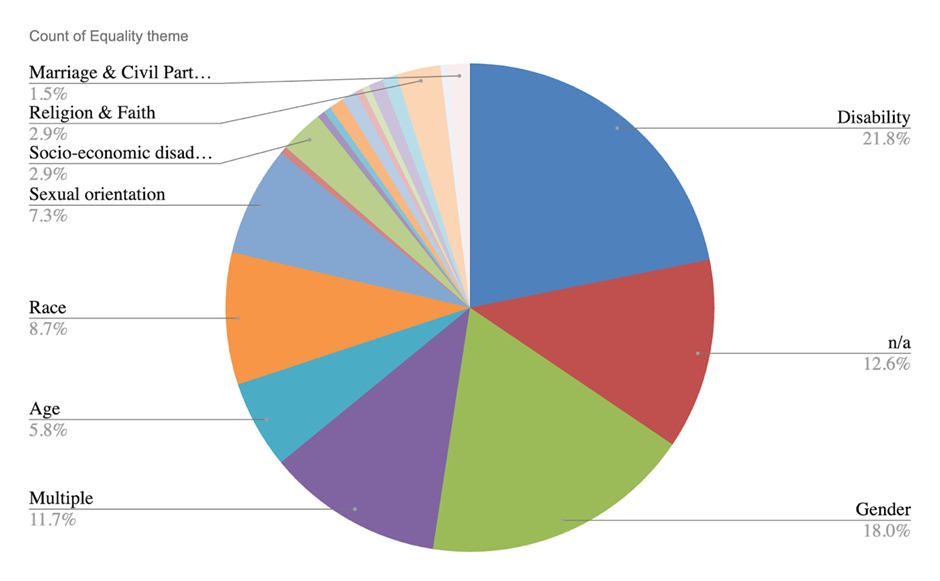
Chart 1: Pie Chart Showing Literature Themes as available from the Research Scotland Database
| Literature theme | Percentage of database |
|---|---|
| Age | 5.8% |
| Disability | 21.8% |
| Gender | 18% |
| Marriage & Civil Partnerships | 1.5% |
| Race | 8.7% |
| Religion & faith | 2.9% |
| Sexual orientation | 7.3% |
| Socio-economic disadvantage | 2.9% |
| Multiple | 11.7% |
| n/a | 12.6% |
Evidence database visualisation
As part of refreshing the evidence database several interactive dashboards have been added to the spreadsheet [Include link to the update research database]. These allow dynamic filtering of equalities to see trends over time. Articles have been tagged with equality themes, corresponding with the equalities themes highlighted in sportscotland's EDI toolkit. The articles have been further tagged with more specific themes, which unpick some of the differences within these categories.
Figure 1 shows the overall count and source of the data within the evidence database. Sources include Academic, Government, Grey Literature and National Agency publications. It is clear that different equality themes have been of interest within the academic literature base, whilst others have had more focus through grey and national agency publications.
| Characteristic | National agency | Grey literature | Government | Academic |
|---|---|---|---|---|
| Pregnancy & maternity | 0 | 1 | 0 | 0 |
| Care experience | 2 | 8 | 1 | 7 |
| Religion & belief | 4 | 1 | 3 | 5 |
| Gender reassignment | 0 | 21 | 1 | 5 |
| Sexual orientation | 2 | 21 | 1 | 4 |
| Poverty & low income | 2 | 3 | 1 | 7 |
| All | 29 | 13 | 16 | 18 |
| Sex | 16 | 23 | 3 | 28 |
| Race & ethnicity | 7 | 9 | 4 | 56 |
| Social inclusion | 1 | 3 | 1 | 4 |
| Rural exclusion | 2 | 1 | 2 | 9 |
| Marriage & civil partnership | 0 | 0 | 0 | 2 |
| Disability | 22 | 26 | 14 | 23 |
| Age | 7 | 7 | 6 | 15 |
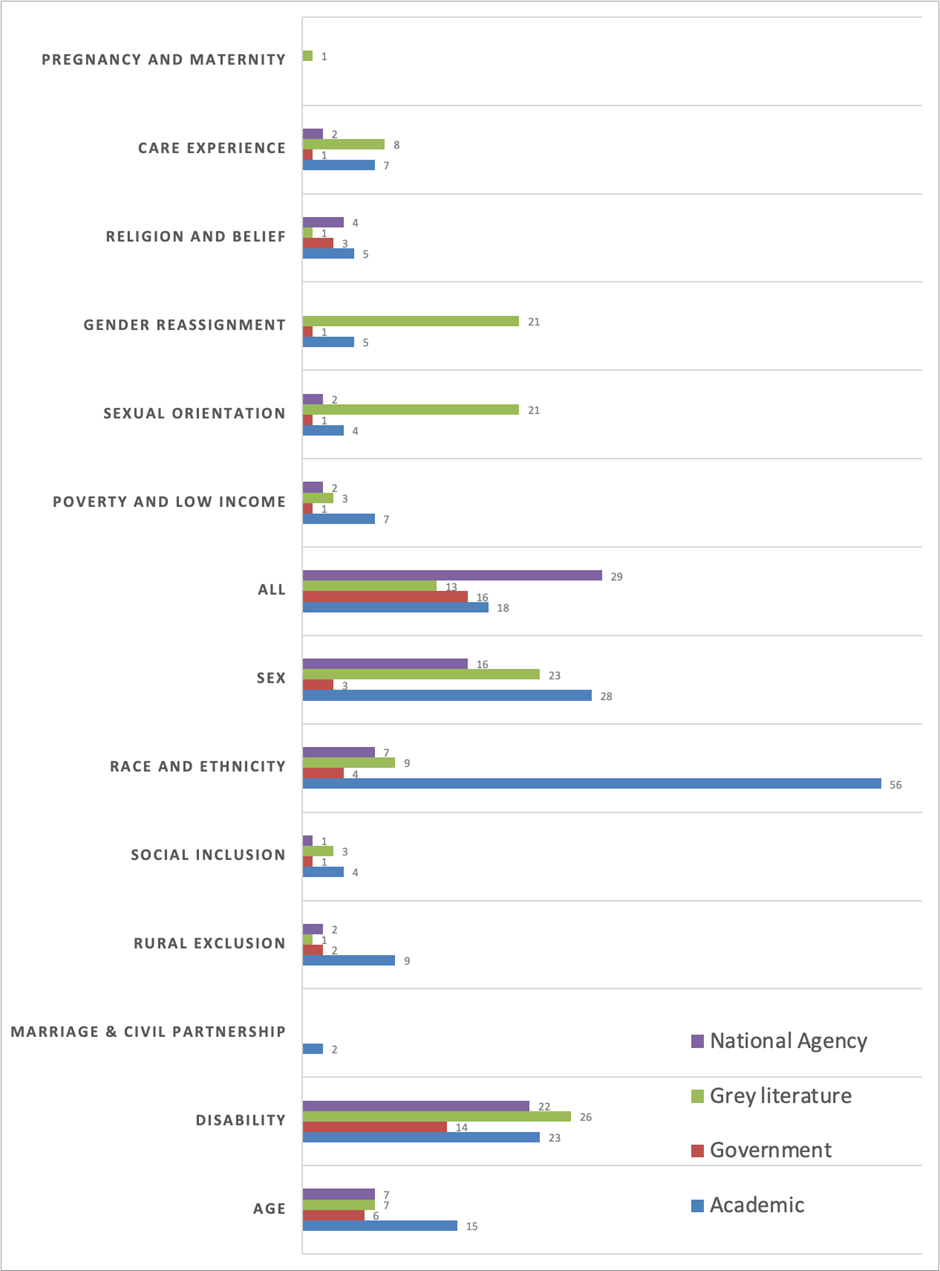
Figure 1: Overall count and source of date within the evidence database, by theme